


Sexually transmitted diseases (STDs)—also referred to as sexually transmitted infections (STIs)—remain a persistent public health challenge in the United States, affecting millions of people each year. The Centers for Disease Control and Prevention (CDC) estimates that at any given time, one in five Americans is living with an STI, contributing to billions of dollars in healthcare costs annually.
STD cases tend to peak during the summer, a trend attributed to increased social activity, travel, and sexual behavior during warmer months. However, the broader patterns that shape the spread of sexually transmitted infections are influenced by a more complex set of factors. These include disparities in access to healthcare, varying levels of sexual health education, differences in testing and screening practices, and persistent social and economic inequities. Together, these elements contribute to sustained transmission rates in certain populations and geographic areas—many of which experience disproportionately high rates of new infections year after year.
To better understand these trends, Invigor Medical—a telehealth company focused on the wellness space—analyzed newly reported STD cases using the most recent CDC surveillance data. The analysis focuses on four of the most consistently tracked infections—Chlamydia, Gonorrhea, Syphilis, and HIV—and examines how rates have changed over time, how they differ by demographic groups, and where they are most concentrated geographically.
Here are some of the key findings from the report:
- STD rates have risen significantly over the past decade, with nearly 2.5 million new infections reported in 2023—up from 1.8 million in 2013. Syphilis shows the sharpest increase, while HIV remains relatively stable.
- Young women face the highest rates of infection, driven largely by high Chlamydia rates among females under 25. STD diagnoses decline significantly with age for both sexes.
- Black Americans experience STD rates over seven times higher than White Americans, reflecting deep and persistent racial disparities in healthcare access, prevention, and treatment.
- Southern states report the highest STD rates, led by Louisiana and Mississippi. New York and South Dakota stand out as regional outliers, driven by factors such as urban density and outbreaks in Native American communities.
- New England states report the lowest rates, likely due to older populations, less demographic risk exposure, higher income levels, and better access to healthcare.
- There are early signs that the STD epidemic may be slowing, with new data from the CDC showing leveling or slight declines across the most common diseases.
How Have STD Rates Changed Over Time?
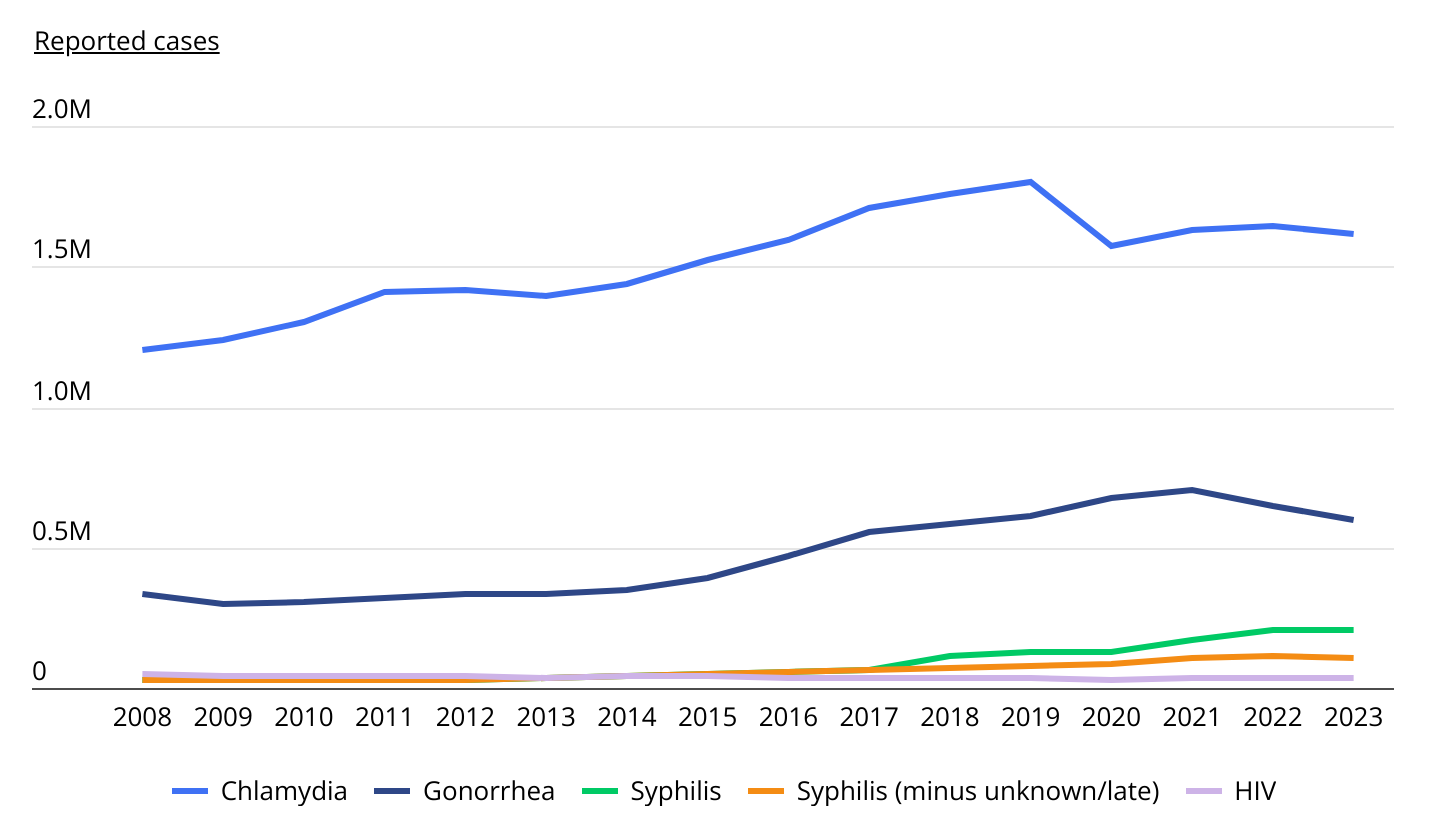
In 2023, there were approximately 2.5 million new STD cases, up from 1.8 million in 2013
Source: Invigor Medical analysis of CDC data
The number of newly reported sexually transmitted infections in the U.S. has climbed sharply over the past decade. In 2023, health officials recorded approximately 2.5 million new cases of Chlamydia, Gonorrhea, Syphilis, and HIV—up from 1.8 million in 2013.
Chlamydia remains the most prevalent STD, with more than 1.6 million new cases in 2023, while Gonorrhea nearly doubled over the decade, reaching almost 595,000 cases. Syphilis saw the sharpest rise, increasing sixfold from 34,279 cases in 2013 to over 205,000 in 2023. Part of this increase reflects a change in CDC reporting: prior to 2018, late-stage and unknown-stage Syphilis cases were not included in national totals. But even when excluding those later-stage cases, Syphilis diagnoses still tripled over the decade. In contrast, HIV diagnoses remained relatively flat over the same time period—reflecting the impact of expanded testing, prevention tools like PrEP, and earlier treatment.
Although the long-term trend shows a sustained rise in STD cases, recent data suggests the epidemic may be starting to slow. While Syphilis infections remain at record highs, reported cases of Chlamydia, Gonorrhea, and HIV have declined from their peak levels in previous years, signaling a promising shift in the trajectory of the nation’s STD burden.
Do Men or Women Have Higher Rates of STDs?
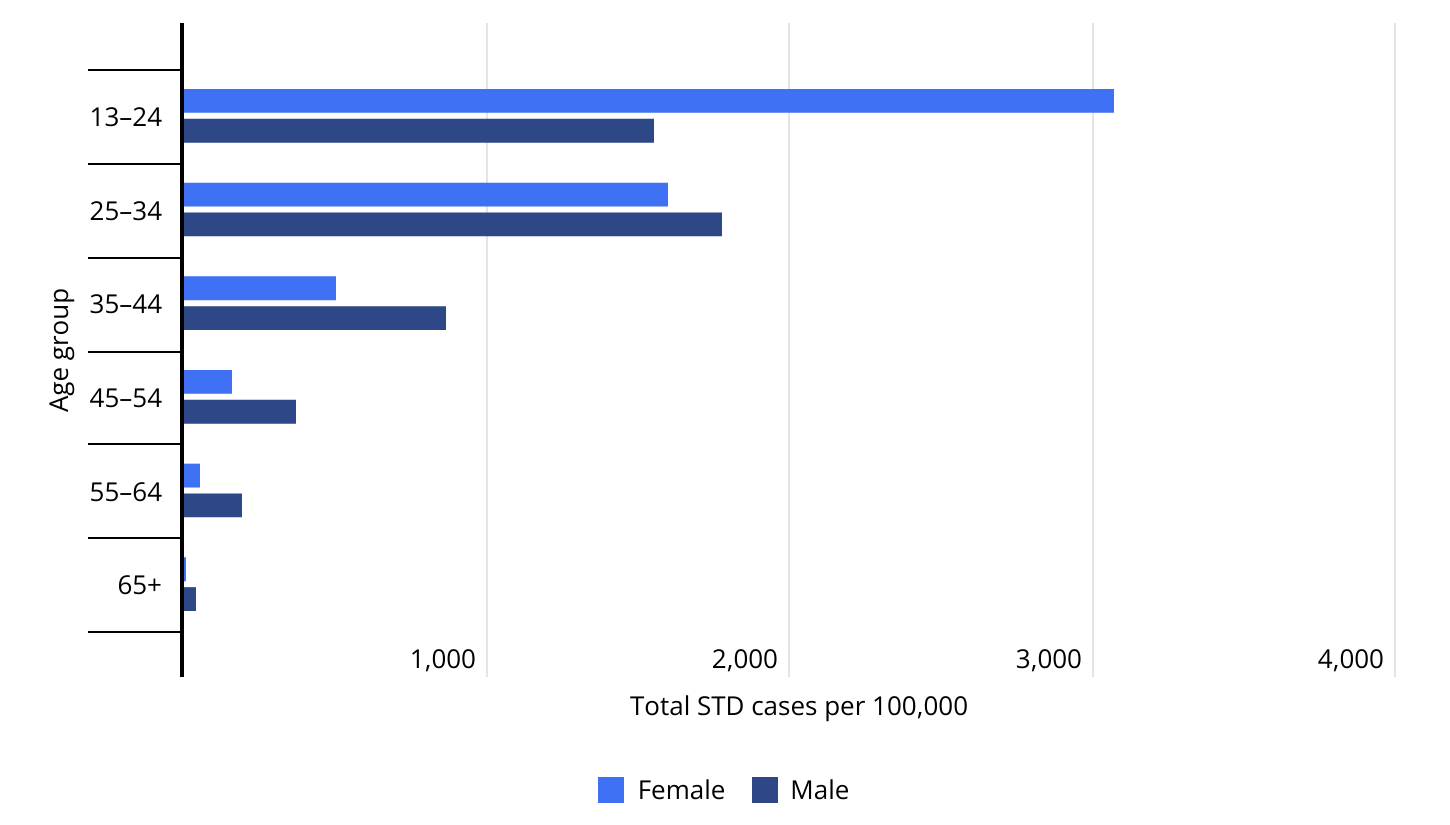
Women are 10% more likely to be diagnosed with an STD than men
Source: Invigor Medical analysis of CDC data
Nationally, women are about 10% more likely than men to be diagnosed with a sexually transmitted disease. Across all age groups 13 years and over, there were 902.0 reported STD cases per 100,000 women, compared to 819.0 per 100,000 men. This gender gap is especially pronounced among adolescents and young adults, and reflects several overlapping factors. Biological differences make women more susceptible to infection than men. Additionally, women are more likely to be screened during routine reproductive health visits, often beginning in adolescence or early adulthood. By contrast, men are typically only tested when symptoms are present, which leads to lower reported rates.
As a result, females ages 13 to 24 have the highest STD diagnosis rate of any demographic group, with more than 3,000 cases per 100,000, nearly double the rate for males in the same age range. After age 25, STD rates decline significantly for both sexes. Among women, the rate drops by nearly half in the 25–34 age group and continues to decline steeply with age. For men, diagnosis rates peak slightly later—between ages 25 and 34—before following a similar downward trend.
STD Rates by Race & Ethnicity
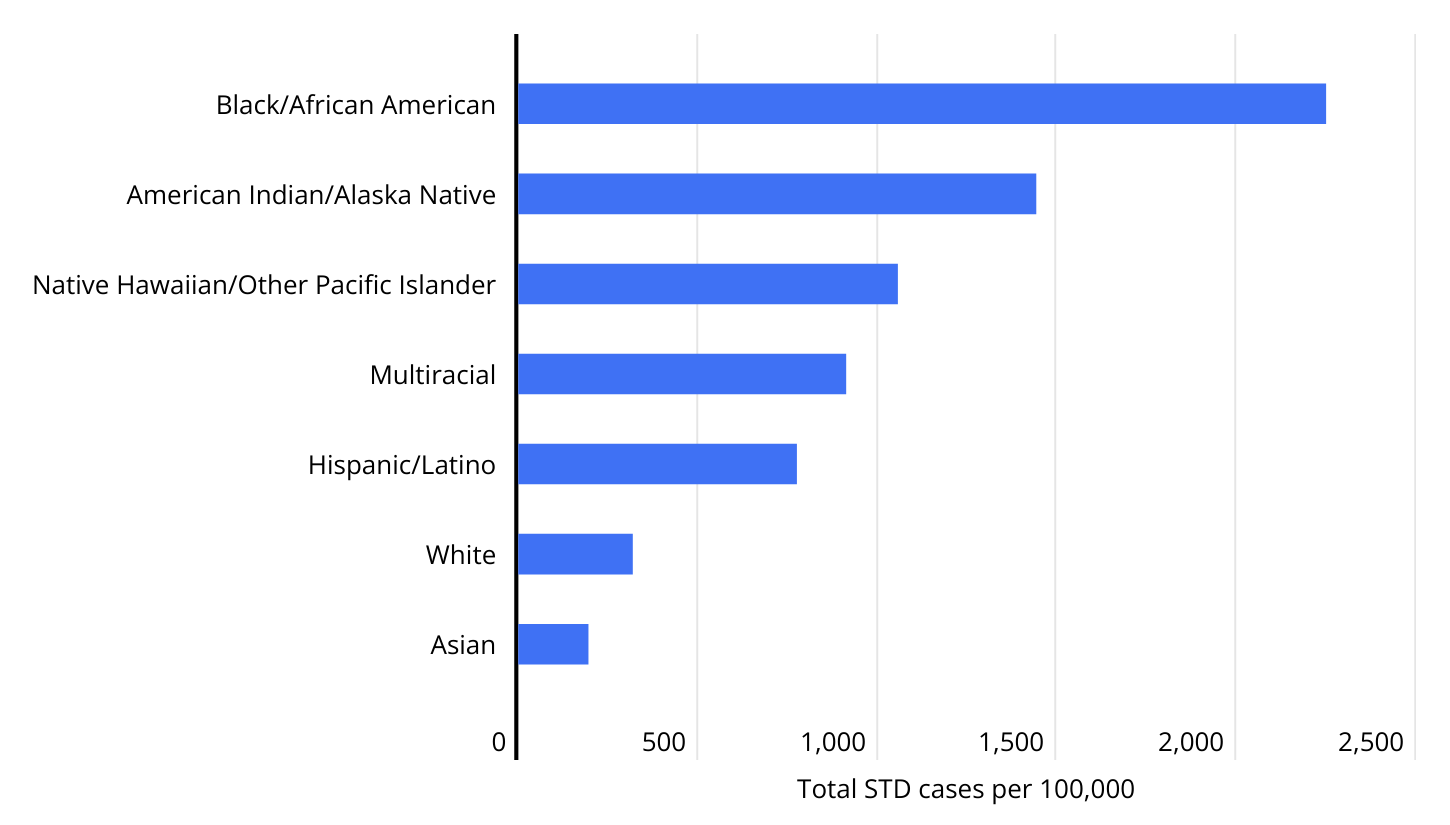
Black Americans have 7 times the reported rate of STDs compared to their White counterparts
Source: Invigor Medical analysis of CDC data
Racial and ethnic disparities in STD cases remain one of the most persistent and pronounced features of the epidemic. In 2023, Black Americans had a reported STD rate more than seven times higher than that of White Americans—2,249.7 cases per 100,000 compared to 319.0, respectively. This gap reflects long-standing inequities in healthcare access, prevention resources, and social determinants of health.
High STD rates are also observed among American Indian and Alaska Native populations (1,442.6 per 100,000) and Native Hawaiian and Other Pacific Islander groups (1,057.2 per 100,000). In contrast, Asian Americans report the lowest rate at 195.5 cases per 100,000.
Public health experts caution that these disparities are not due to differences in behavior alone, but are also shaped by systemic factors such as unequal access to testing and treatment, stigma, and community-level barriers to sexual health education and care. These data underscore the need for targeted prevention strategies that take into account these differences.
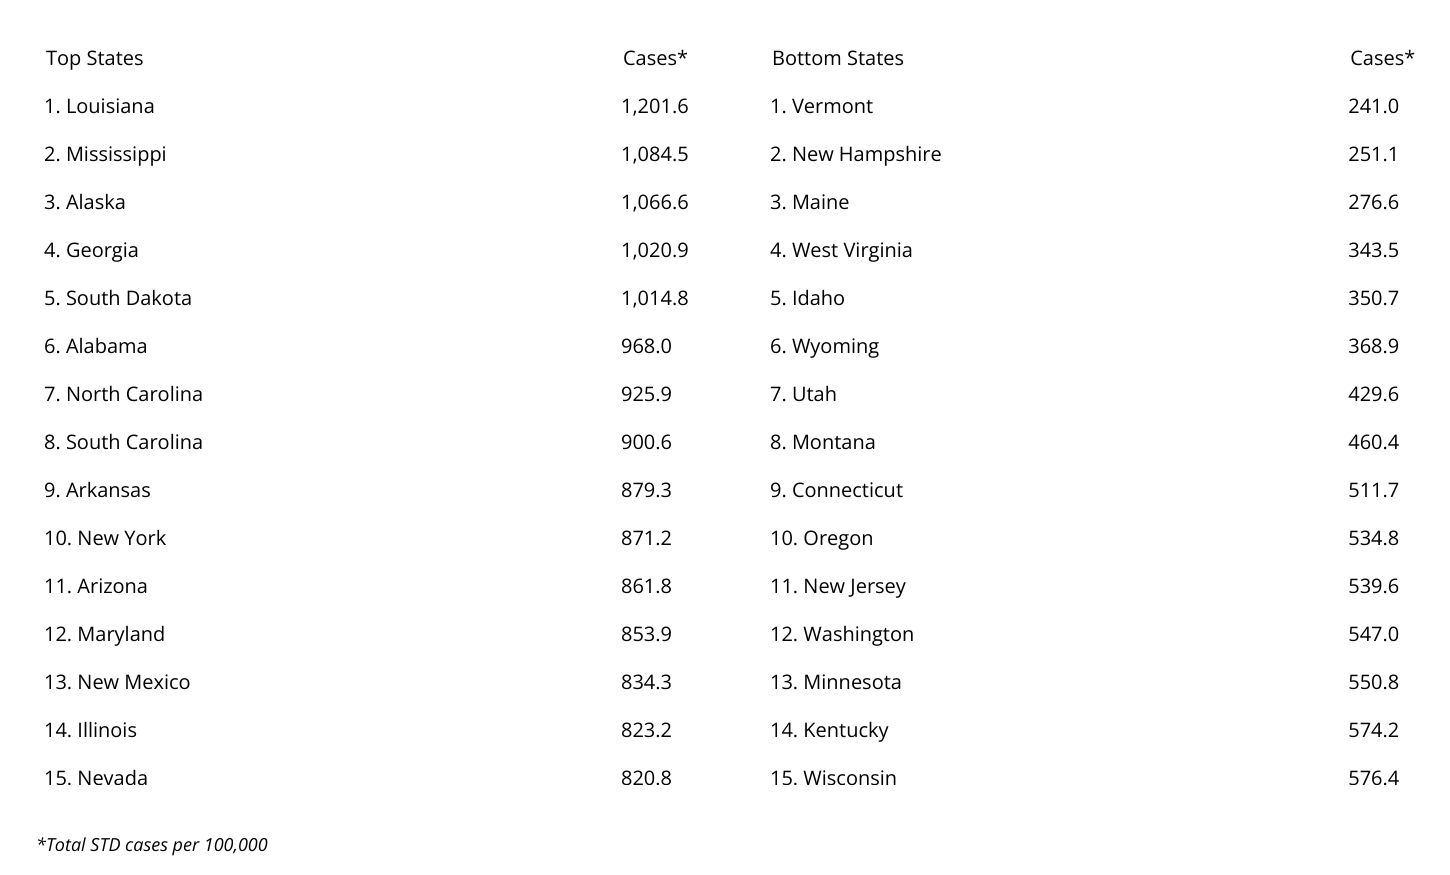
Which States Have the Highest STD Rates?
Neighboring Louisiana and Mississippi report the highest rates of STD cases

Source: Invigor Medical analysis of CDC data
STD rates vary widely across the United States, with the highest concentrations currently found in the South. Louisiana and Mississippi report the highest rates, with 1,201.6 and 1,084.5 cases per 100,000 people, respectively. They are followed closely by Alaska (1,066.6) and Georgia (1,020.9)—making them the only states where STD rates exceed 1,000 cases per 100,000 residents.
Several other Southern states—Alabama, North Carolina, South Carolina, and Arkansas—also rank among the top 10. These states tend to face persistent challenges in STD prevention, including gaps in healthcare access, limited sexual health education, and structural barriers to screening and treatment. Outside of the Southern U.S., South Dakota and New York also report relatively high rates despite different demographic and policy contexts. In South Dakota, higher rates may be influenced by concentrated outbreaks in Native American communities, which face elevated STD burdens due to systemic healthcare inequities and limited access to services on tribal lands. In New York, elevated case rates are largely driven by urban density, high concentrations of at-risk populations, and possibly more robust surveillance, which can result in higher reported case counts.
In contrast, states in New England consistently report the lowest STD rates nationwide. Vermont (241.0), New Hampshire (251.1), and Maine (276.6) sit at the bottom of the list, with rates less than one-fourth of those in the highest-burden states. Several demographic and structural factors help explain this pattern. New England states tend to be older and have less ethnic diversity, both of which are associated with lower STD risk. Additionally, the region has higher median household incomes and lower uninsured rates, making it easier for residents to access testing and treatment—and thus reducing the rate of spread.
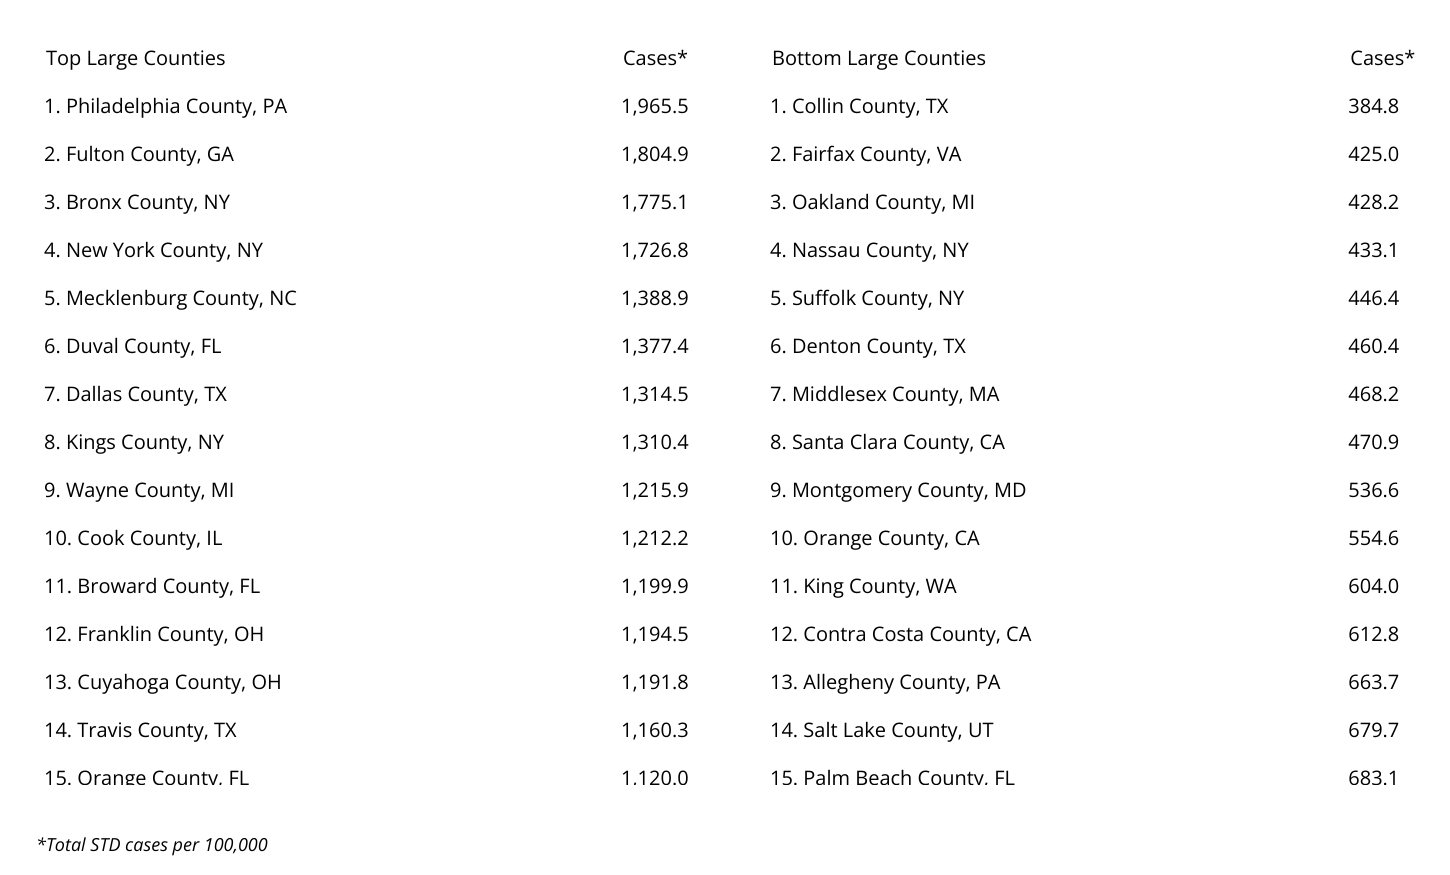
The tables below provide a detailed breakdown of the states and counties with the highest and lowest reported rates of sexually transmitted diseases. For additional information and complete results, see the original post on Invigor Medical: STD Hotspots: States & Counties With the Highest Infection Rates.
Large U.S. Counties With the Highest and Lowest STD Rates
States With the Highest and Lowest STD Rates
Methodology

Photo Credit: Kzenon / Shutterstock
This study analyzes newly reported cases of sexually transmitted infections (STIs) across the United States, using data from the Centers for Disease Control and Prevention’s National Center for HIV, Viral Hepatitis, STD, and TB Prevention (NCHHSTP). The focus is on four of the most consistently tracked STIs with available county- and state-level data: Chlamydia, Gonorrhea, Syphilis (including primary, secondary, early latent, and late/unknown stages), and HIV. While Human papillomavirus (HPV) is the most common STD nationally, it is excluded from this analysis due to the absence of a centralized case-reporting system and the typically asymptomatic nature of the infection.
The rankings are based on the number of newly reported cases tracked by the CDC in 2023 per 100,000 residents, not the total number of people currently living with each infection. For HIV, reporting is limited to individuals aged 13 years and older, whereas cases of Chlamydia, Gonorrhea, and Syphilis include individuals of all ages. To ensure reliable comparisons, only states and counties with complete reporting and a population of at least 200,000 were included in the analysis. Counties were further grouped by population size into three cohorts: small (200,000–499,999), midsize (500,000–999,999), and large (1,000,000 or more).
For complete results, see STD Hotspots: States & Counties With the Highest Infection Rates on Invigor Medical.