America’s housing stock is aging, with the majority of homes across the country built decades ago. According to recent data from the Census Bureau, the median age of a home in the U.S. is now over 40 years old, underscoring the need for both renovation of existing properties and the construction of new ones to meet growing demand.
New construction homes offer several advantages, including more contemporary designs, better energy efficiency, and lower maintenance costs. However, these benefits often come with a higher price tag and limited availability, especially in densely populated urban areas.
To help homebuyers find which locations have the most newly-built homes for sale and what they can expect to pay, researchers at Construction Coverage, a website that provides construction software and insurance reviews, analyzed the latest data from Zillow and the Census Bureau. Here’s what they found.
Key Takeaways:
- America’s housing stock is aging. Over the past several decades, the median age of U.S. homes has risen significantly, increasing from 30 years in 2000 to 42 years today. The typical home in the country was built in the early 1980s, reflecting the ongoing challenge of increasing housing supply.
- New construction is limited. Over the past year, only about 10.8% of homes sold in the U.S. were newly built. This limited supply of new construction highlights the scarcity of newer options nationally.
- New construction comes at a premium. Buyers of newly-built homes paid, on average, 16% more than average—equivalent to an additional $75,552. The average sale price for new construction homes was $549,075, compared to $473,523 for homes overall.
- Regional differences in new construction. In certain markets, particularly in the South and Mountain West, new construction makes up a significantly larger share of home sales. For example, in Jefferson, GA and Boise, ID, over half of all home sales in the past 12 months were for newly-built homes.
New Construction Share of Home Sales
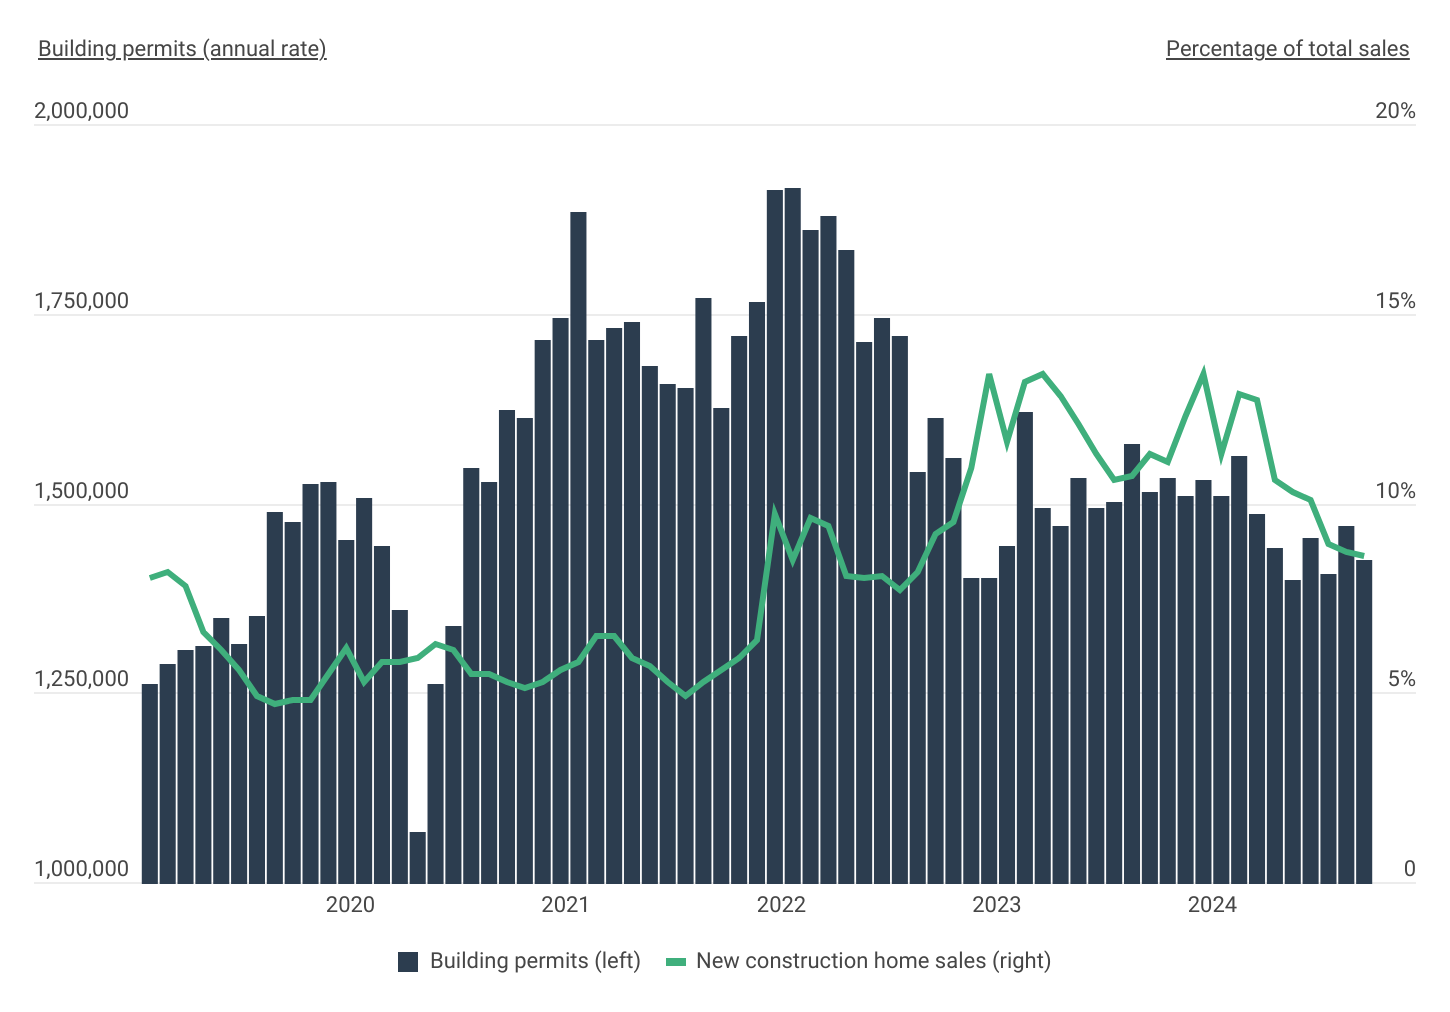
After increasing in 2022 and 2023, new construction sales are declining

Source: Construction Coverage analysis of Census Bureau and Zillow data | Image Credit: Construction Coverage
The housing market saw a significant boom in new construction during the period from mid-2020 to mid-2022, fueled by low interest rates, strong demand, and a surge in homebuyer activity. During this time, building permits increased from a seasonally adjusted annual rate of nearly 1.4 million before the pandemic to a high of over 1.9 million in January of 2022. However, as interest rates began to climb that year and the broader housing market cooled, new construction activity slowed substantially.
The changes in building activity are mirrored in the composition of home sales, albeit with a clear lag. In early 2020, new construction accounted for roughly 6% of total home sales—a figure that remained stable through the end of 2021 despite the surge in building activity. By 2023, as newly-constructed homes began entering the market, the share of new construction sales climbed to a peak of over 13%. However, as the effects of reduced construction activity hit the market, the percentage of homes sold as new builds began receding back to pre-pandemic levels.
New Construction Home Sales by Metropolitan Area
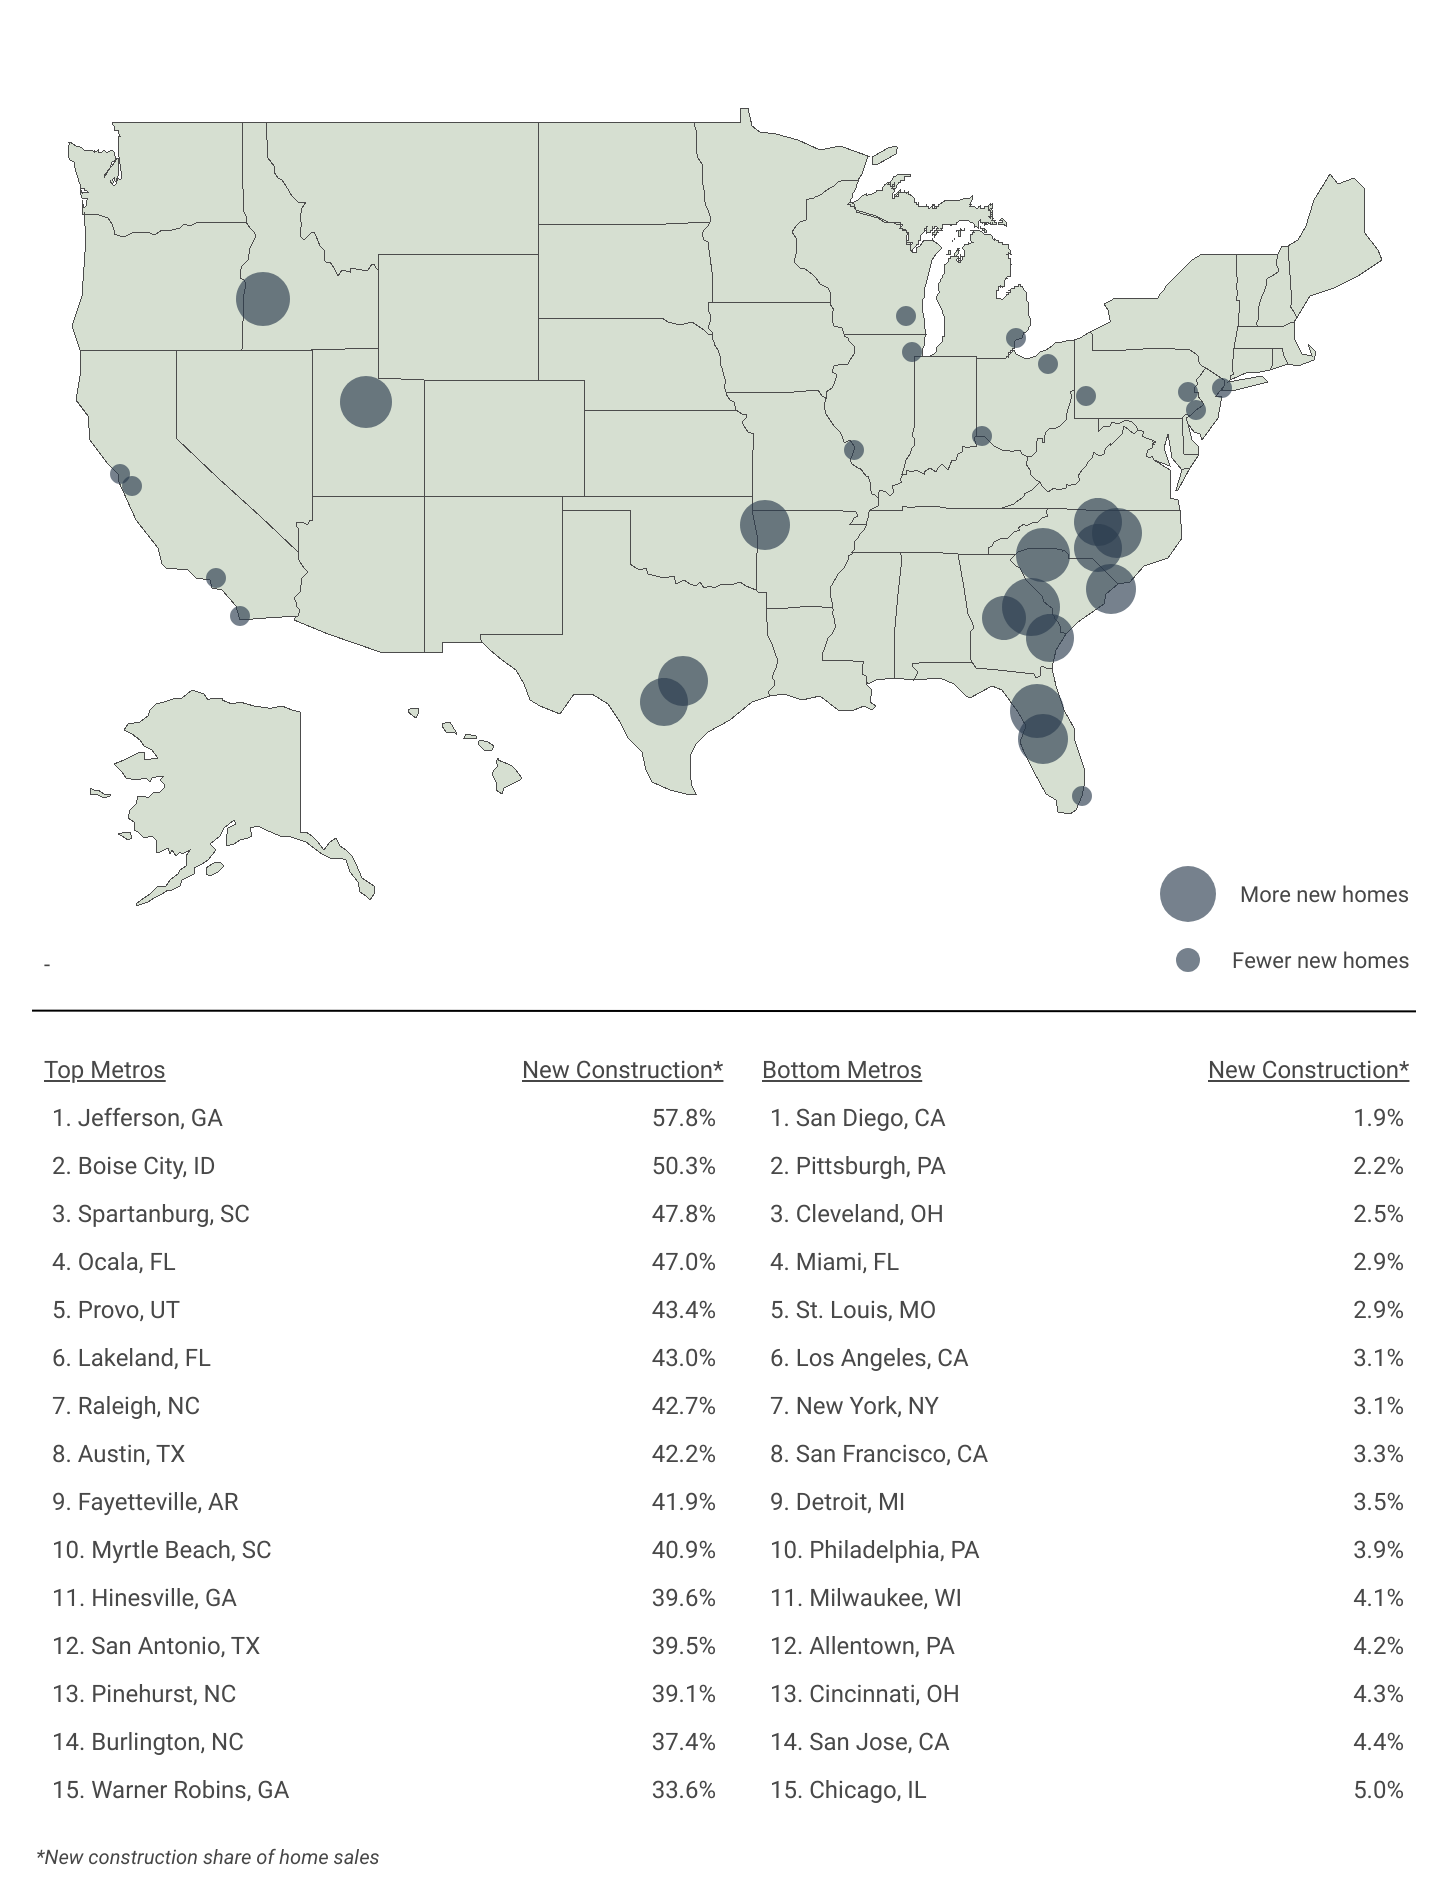
Buyers are most likely to find newly-built homes in the South & Mountain West

Source: Construction Coverage analysis of Zillow data | Image Credit: Construction Coverage
Despite the recent decline in new construction sales nationally, prospective buyers looking for new homes can still find plenty of options in certain markets. Regions in the South and Mountain West dominate the list of areas where new construction accounts for a significant share of home sales. These regions have experienced steady population growth, ample land availability, and developer-friendly policies, leading to higher rates of homebuilding compared to other parts of the country.
In Jefferson, GA, new construction homes represent an impressive 57.8% of all home sales—the highest among metropolitan areas in this report. Similarly, Boise, ID (50.3%) also reports a majority of its sales coming from new construction. Other notable markets include Spartanburg, SC (47.8%), Ocala, FL (47.0%), and Provo, UT (43.4%), all of which boast percentages that are at least four times higher than the national average. While new construction prices are slightly above average in Jefferson and Spartanburg, they are roughly equivalent to market averages in Boise, Ocala, and Provo.
On the other hand, coastal metros and many areas in the Midwest show notably low levels of new construction sales activity. High land costs, restrictive zoning policies, and slower population growth have contributed to this trend. For instance, in major markets like San Diego and Miami, newly-built homes account for around 2% of total sales, among the lowest shares in the country. Similarly, Rust Belt cities such as Cleveland (2.5%) and Pittsburgh (2.2%) also rank at the bottom. These areas tend to have an older housing stock and face challenges like limited available land and less developer interest, making it harder for buyers to find recently built homes.
Generally, in markets with limited new construction supply, prices for newly built homes are often significantly higher than the local average. In Miami, for example, the cost of a new construction home is more than double the average price of all homes in the area, reflecting the scarcity and premium associated with new builds in these locations.
For buyers looking for affordable, new construction options, markets in the South and Mountain West stand out as the best options.
Methodology

Photo Credit: Noah Strycker / Shutterstock
To identify the cities where homebuyers are most likely to find a newly-built home, researchers at Construction Coverage analyzed the latest data from Zillow, focusing on home sales over the 12 months ending in September 2024. Metropolitan statistical areas (MSAs) were ranked based on the share of total home sales accounted for by new construction during this period. Additionally, researchers calculated both the average sale price for new construction and the overall average sale price across all homes sold. For additional context, the median year built for the entire housing stock—not just homes sold—was included using 2023 data from the U.S. Census Bureau.
For complete results, see Cities Where You’re Most Likely to Find a Newly-Built Home on Construction Coverage.


